Net Prolongation of Life
Designing the visual argument for a peer-reviewed clinical publication that reframes how cardiologists evaluate LVAD therapy versus heart transplantation—transforming dense registry data into a navigable, evidence-based narrative across a 40+ slide system, interactive clinical tools, and cohesive motion design.
Designing Clinical Advocacy
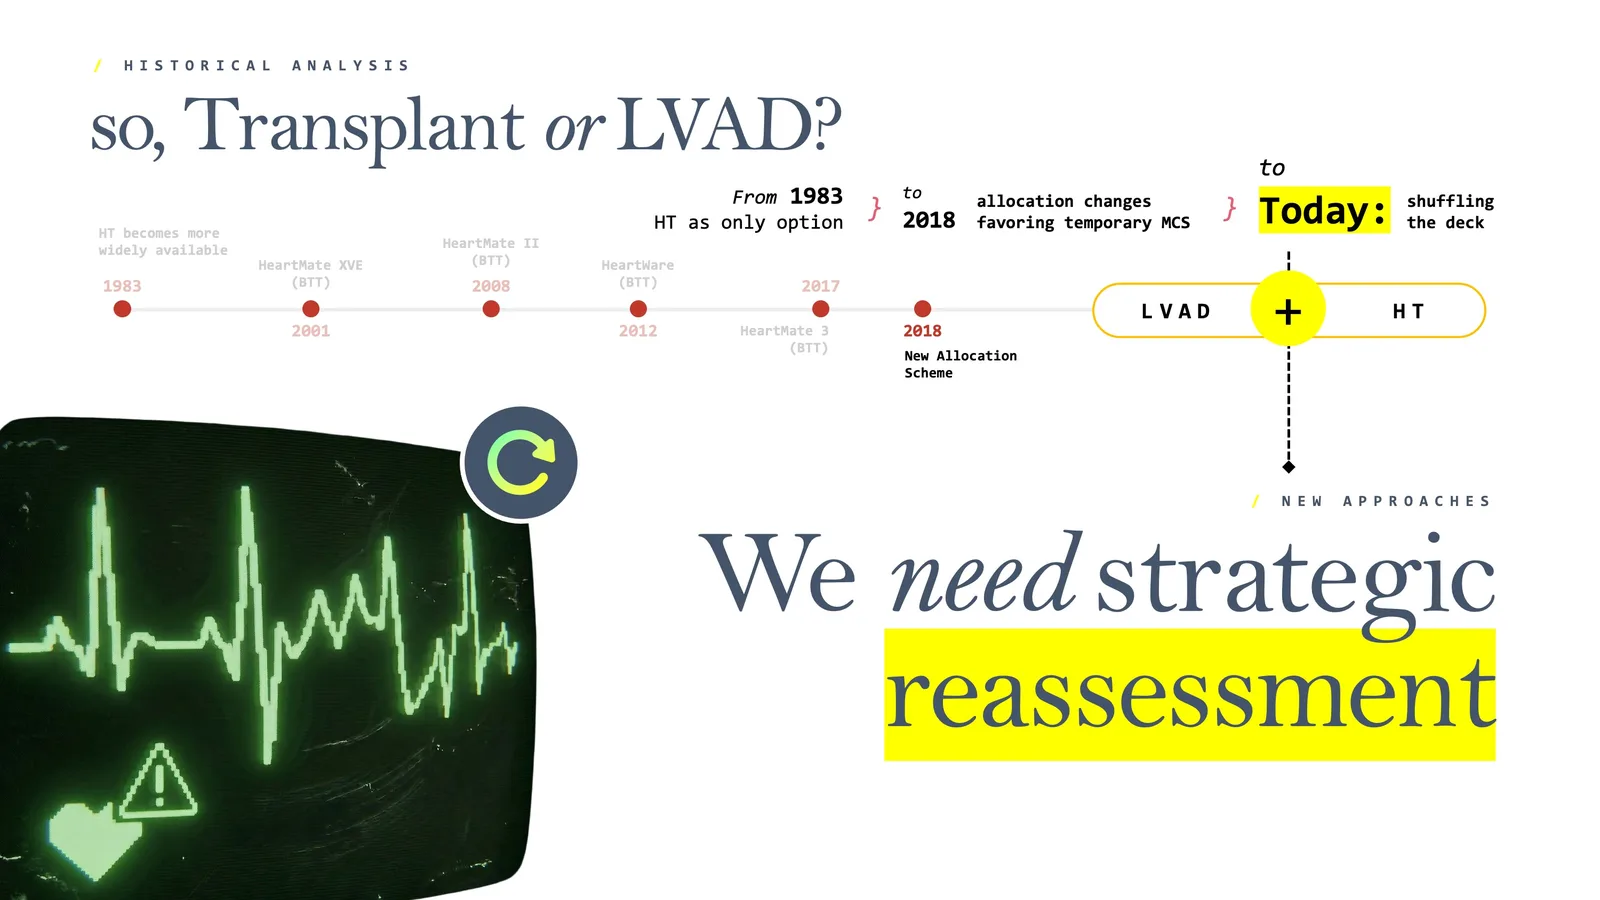
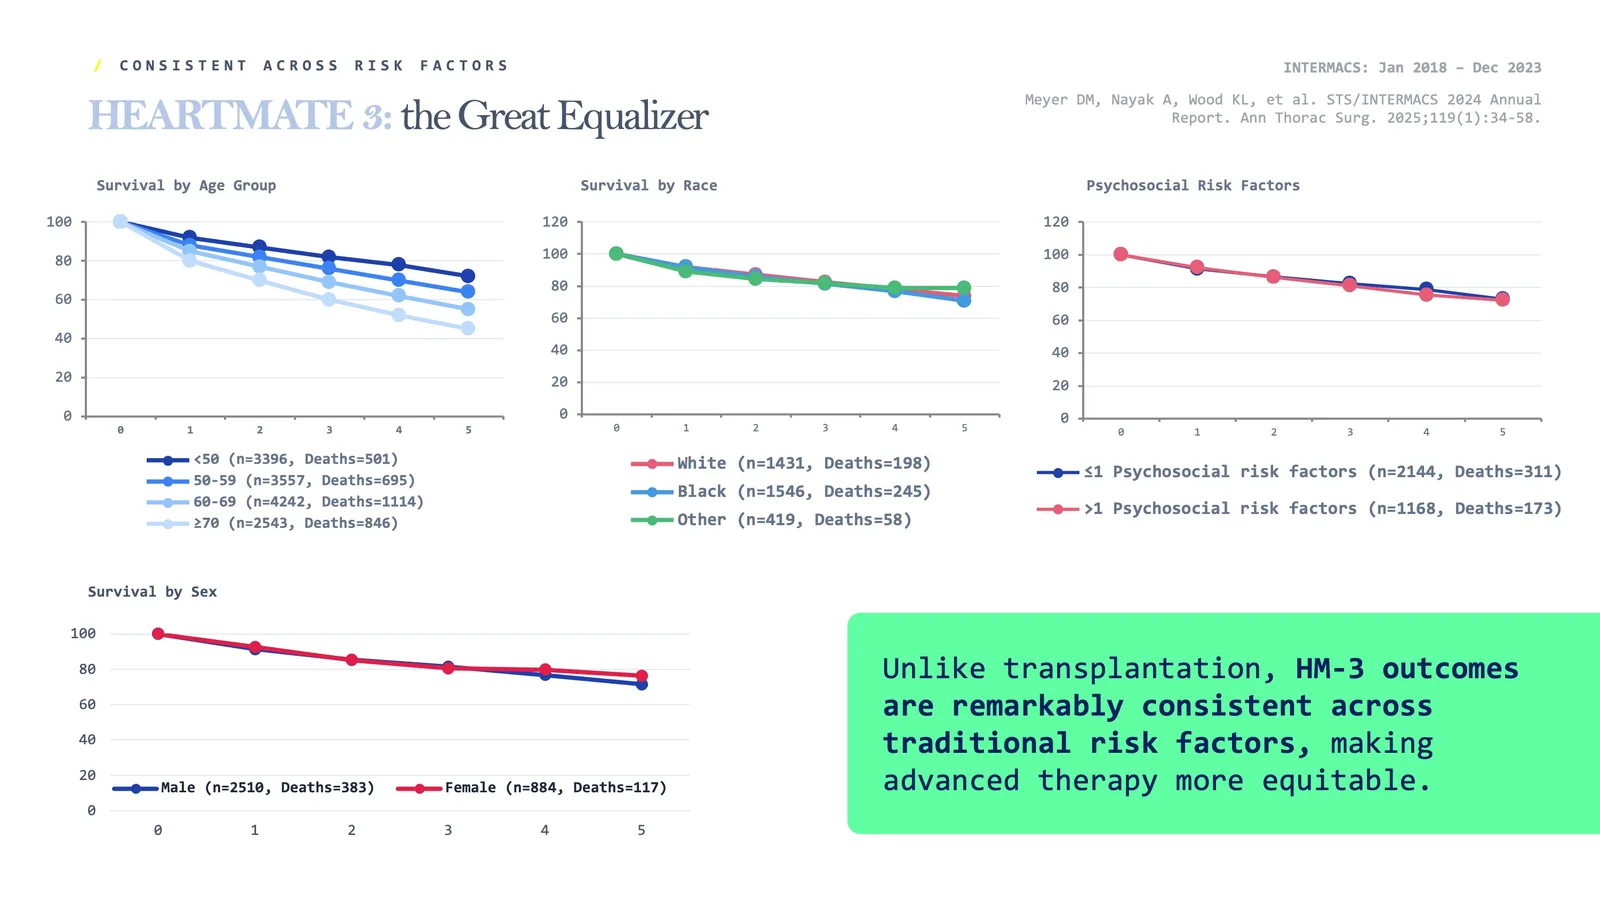
The HeartMate 3 has fundamentally changed outcomes for patients with end-stage heart failure—but the clinical community's assumptions haven't caught up. The data existed. The narrative didn't. We were brought in to build a visual system that could carry a 40+ slide argument from historical context through survival analysis to policy implications, all in service of a manuscript headed for peer review in the Journal of Heart and Lung Transplantation.
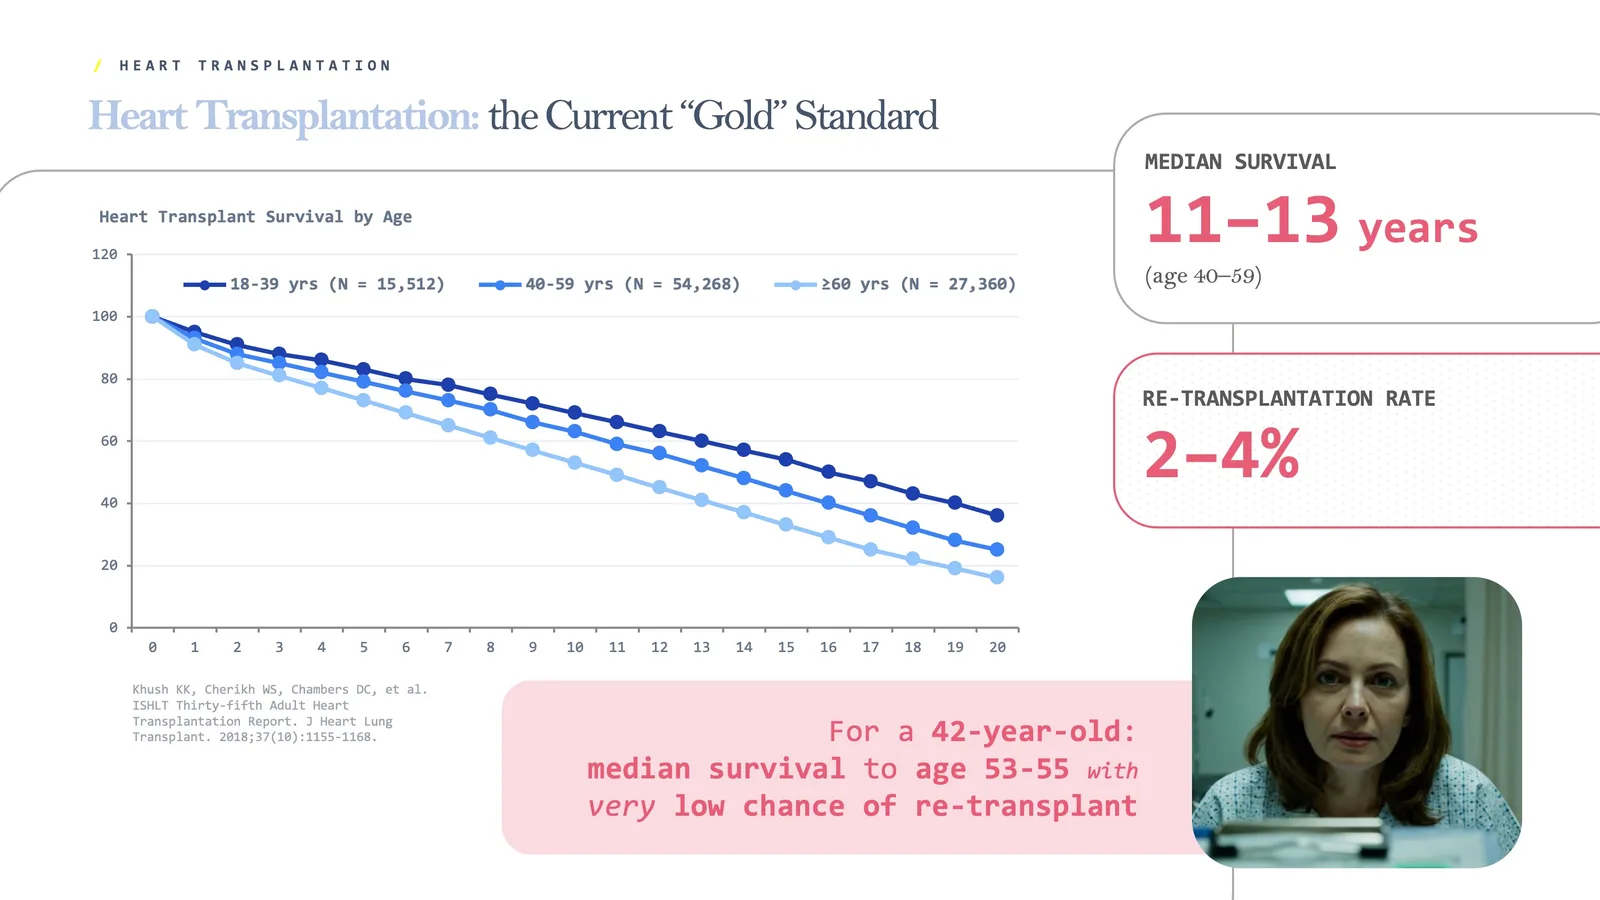
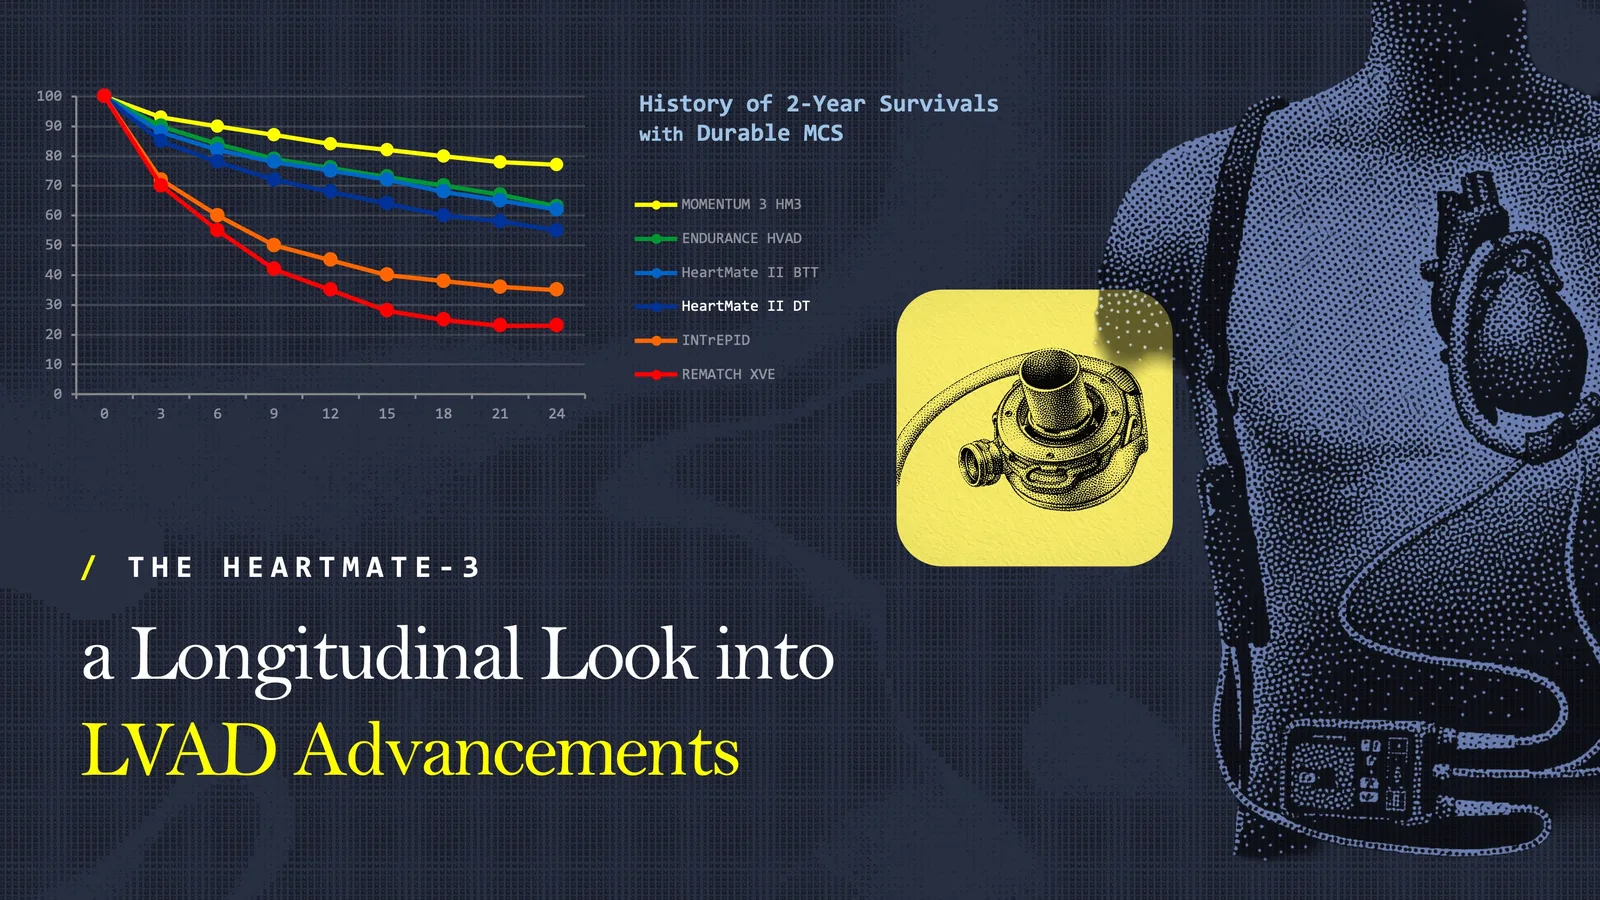
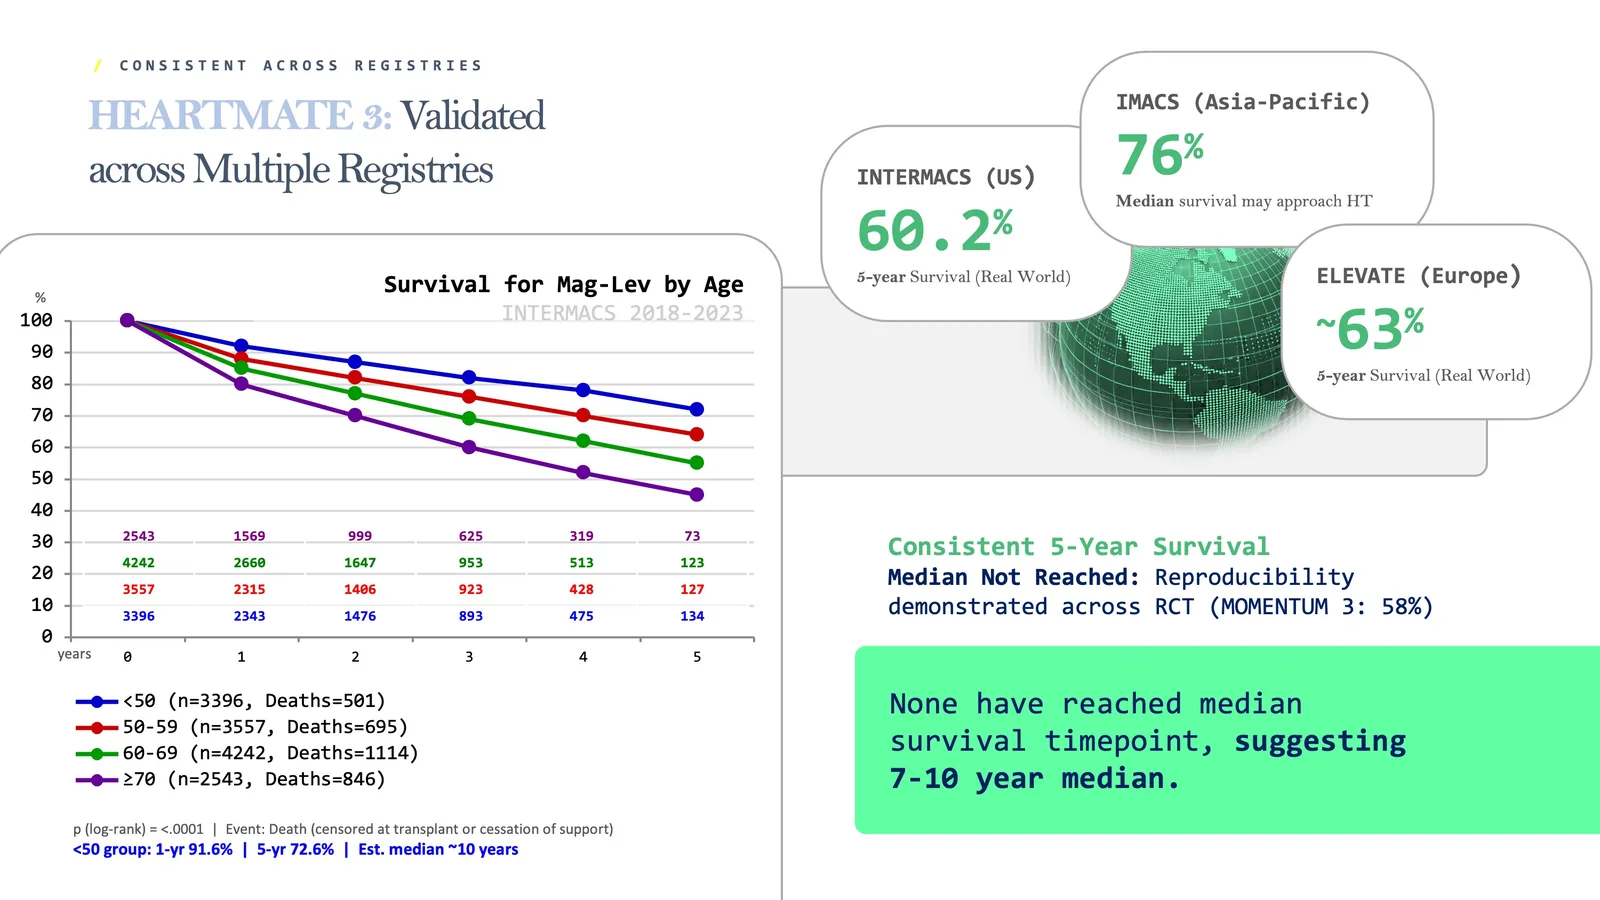
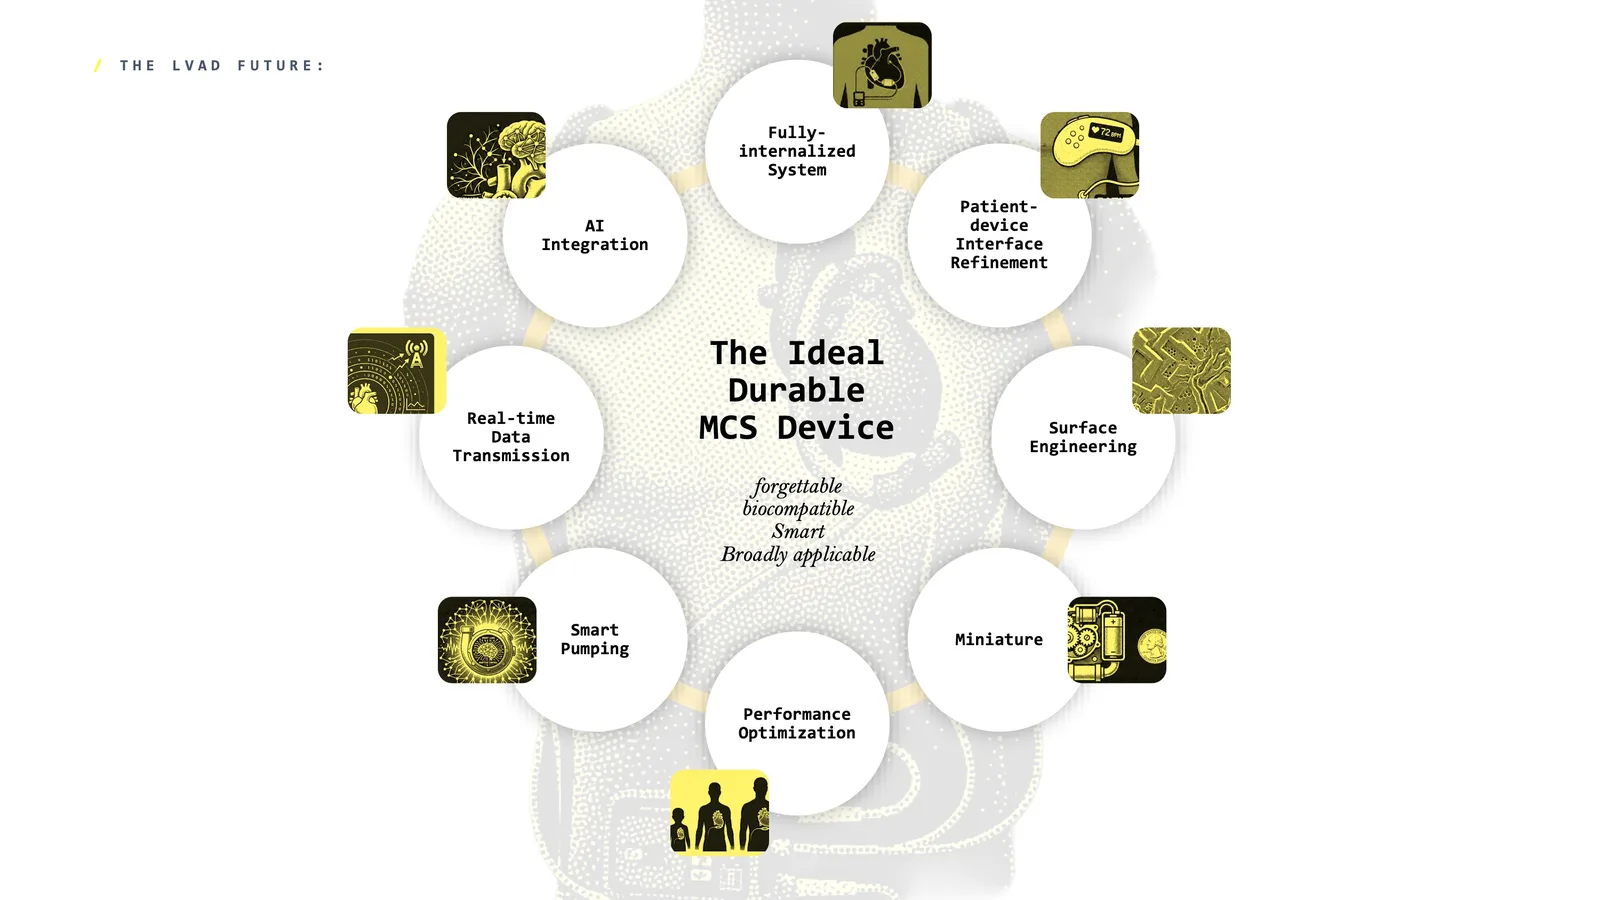
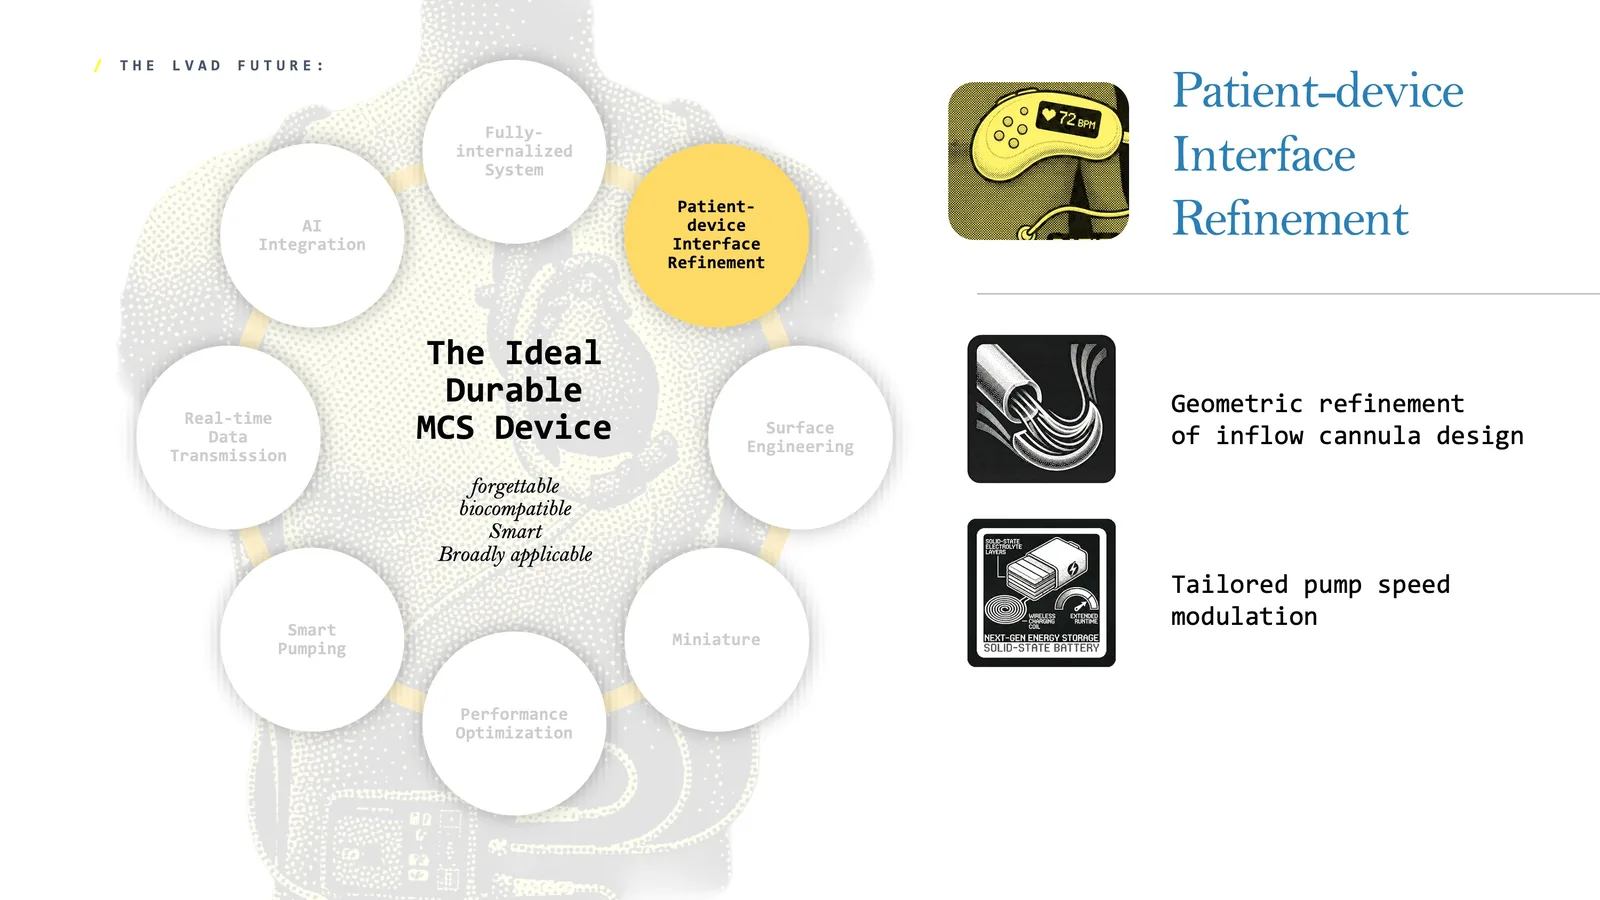
The core design challenge was credibility at scale: monospace typography anchored in data precision, dithered medical illustrations that gave clinical imagery texture without clinical coldness, and a deliberate cinematic framing—a 42-year-old mother with end-stage heart failure—that humanized the statistics without sentimentalizing them. Every chart was reverse-engineered from registry data and rebuilt as fully editable, publication-grade figures.
The Presentation System

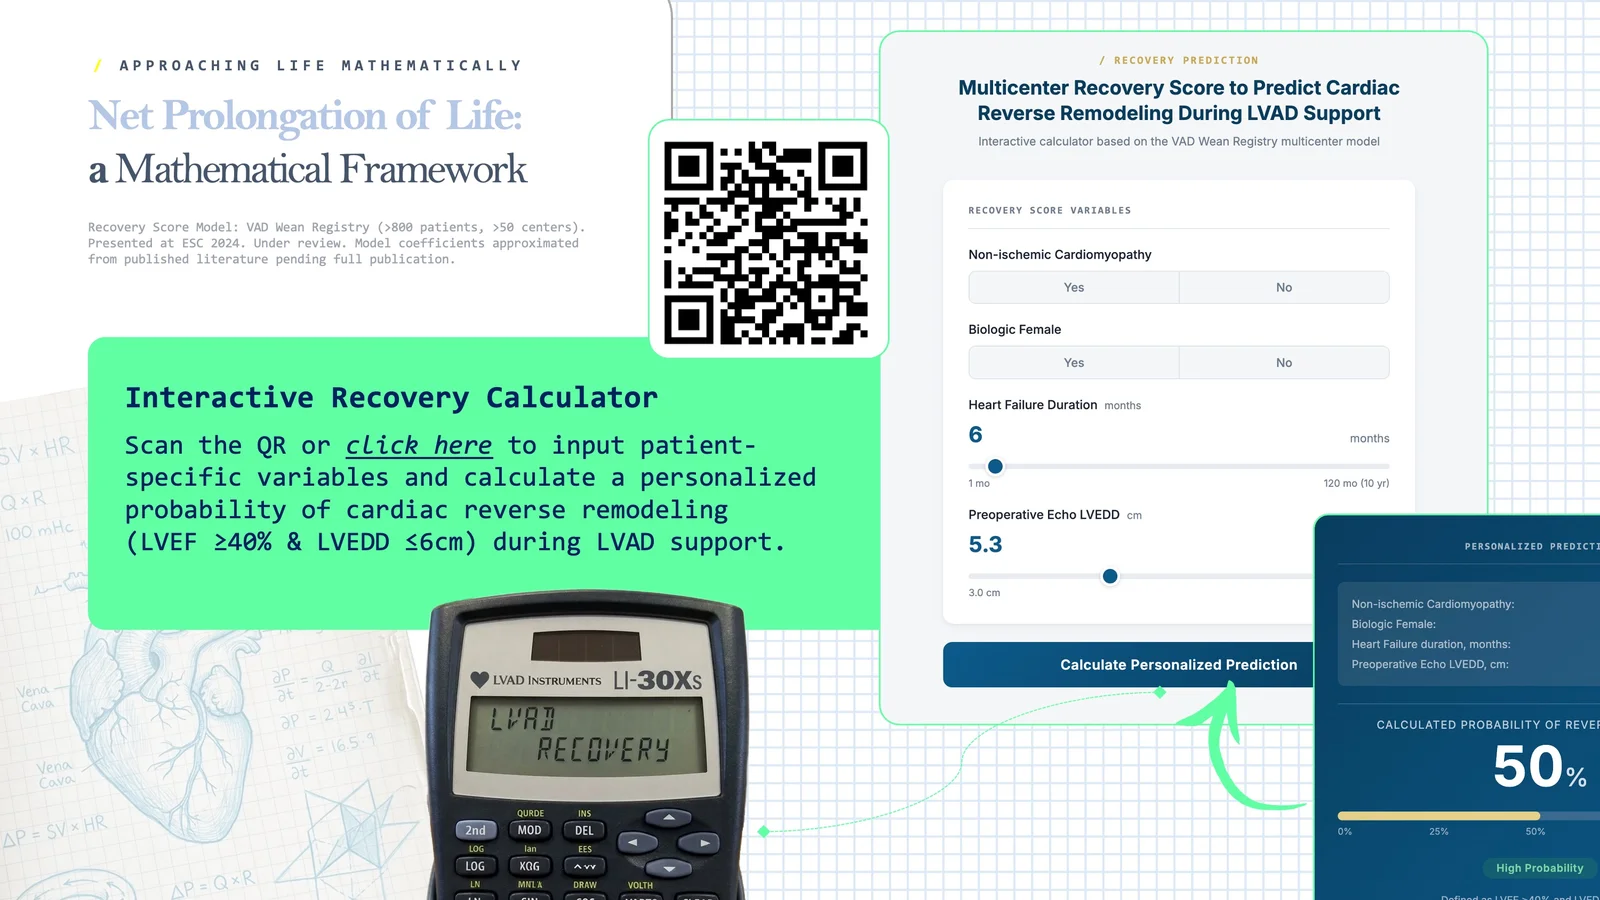
LVAD Recovery Score Calculator
Beyond the presentation, we designed and built a fully interactive clinical tool—a multicenter recovery score calculator based on the HM3 Heart Registry (1,000+ patients, 118 centers). Clinicians input patient-specific variables—cardiomyopathy type, sex, heart failure duration, preoperative echo measurements—and receive a personalized probability of cardiac reverse remodeling during LVAD support.
The calculator transforms a logistic regression model from published literature into something a physician can use at the point of care. Not a slide. A working tool.
Try the CalculatorBeyond the Data

Net Prolongation of Life with Durable Left Ventricular Assist Devices Compared with Listing for Heart Transplantation
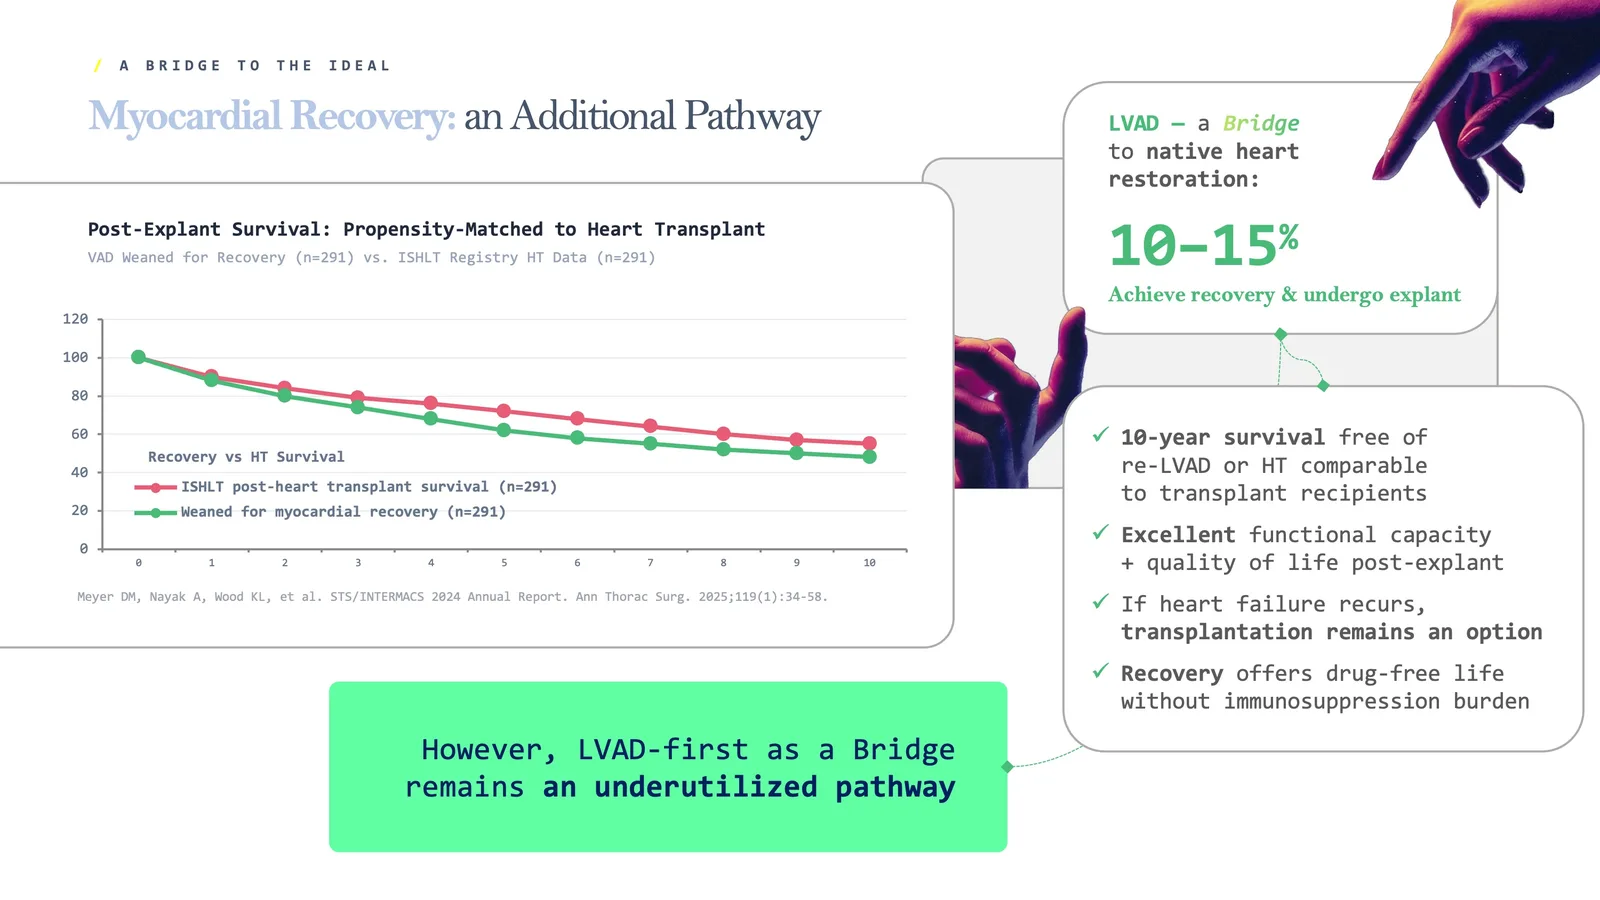
This presentation system was designed to accompany and visually represent the findings of a peer-reviewed manuscript analyzing propensity-matched survival outcomes for LVAD versus heart transplant listing across age strata. The design work stands alongside published science—every chart, figure, and visual argument traces back to registry data cited in the paper.
Read the publication